
Investment Objective
Endeavour to consistently generate ALPHA by investing in India’s Turnaround Businesses where Emerging Leadership & Growth are in common with Turtle’s QUANT-Based Investment Process.
Driven by data, our investment strategy minimizes human bias through a structured, objective process.
Factsheet
Investment Theme
Tailored for first-time PMS investors seeking exposure to high-potential emerging companies with moderate to high volatility, aiming to build long-term wealth.We continuously select, allocate, and review investments through our trademark PPP (Price, Profit, and People) investment process.
Market Capitalization
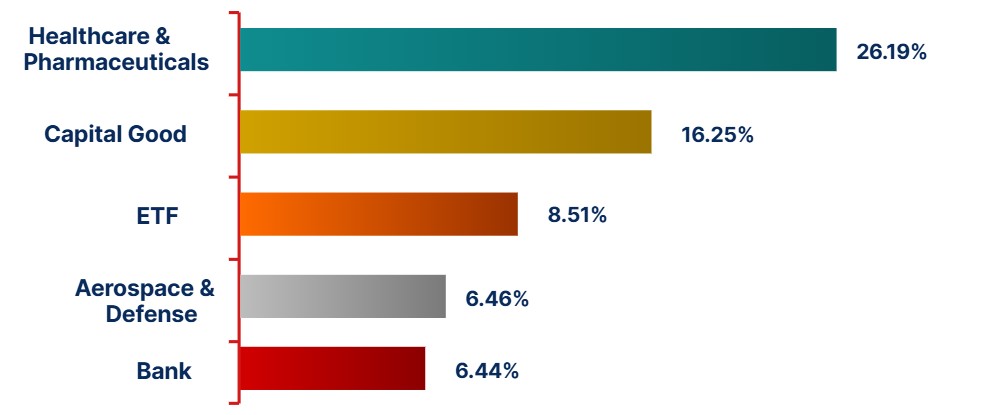
Sector wise allocation
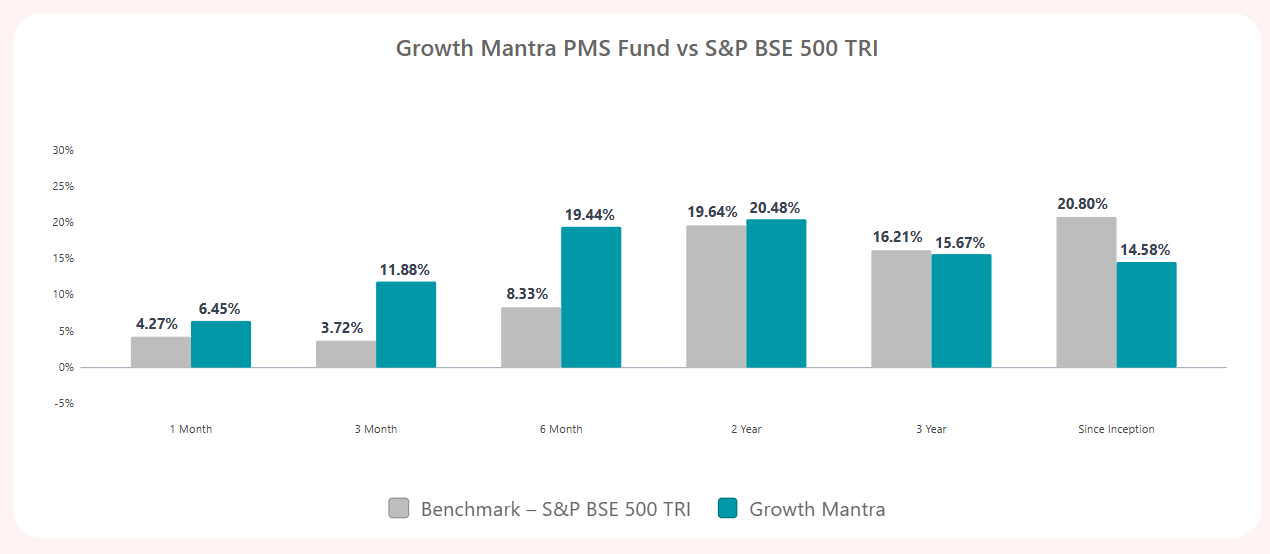
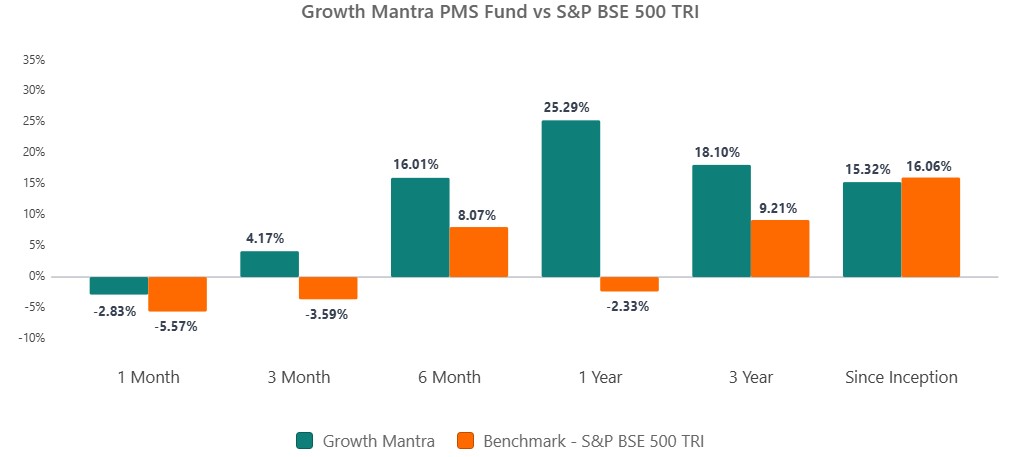
Performance Chart
Growth Mantra PMS Fund vs S&P BSE 500 TRI
PMS Fund details
Inception Date
October 2020
Category
(Small & Mid Cap)
Benchmark
BSE 500 TRI
Minimum Investment
50 Lakhs
Investing Approach
Quant Based
Fund Manager
Mr. Rohan Mehta
Fund Manager

- MBA with 20 Years of Experience in Quant Investing
- Among the Top 10 Fund Manager in FY 25-26
- Curator of www.exitmantra.com – Investing Fintech Platform
- Managing more than 1000+ Cr. Financial Assets
- Author of 212° The Complete Trader
- Passion: Spirituality, Stocks, Squash & Vision Boards
"Don't SELL North, Don't HOLD South, REPLACE East & West!" TM
Fee Structure
Other Charges
The Portfolio Manager shall recover following charges on regular basis from the client at actuals.
Option 1 – Fixed
Fees
2% Fixed Management Fees on
Average Net Asset Value Option 2 – Hybrid Fee Model
Fixed Fee at 1% per annum on AUM and 10% Profit sharing above the Hurdle Rate of 10% on every anniversary date, subject to High Water Mark.Option 3 – Hybrid Fee Model
Fixed Fee at 0% per annum on AUM and 20% Profit Sharing above the hurdle rate of 8% on every anniversary date, subject to High Water Mark.Fee Illustration
Fees Calculator & Illustration
Custodian & Auditor
Custodian
Orbis Financial Corporation Ltd.
Auditor
SecMark Consultancy Ltd.