We all Brush our Teeth in the Morning, but the same thing becomes very hard when it is to be done at night!
The same is true for Equity Investments, we all 😍 Bull Markets, but when it comes to BEAR markets, we are 😨, just like brushing our teeth at night!
Let’s Talk with Data!
“Investment when Correction Comes and Eating only Healthy Food is a Myth 😂!”
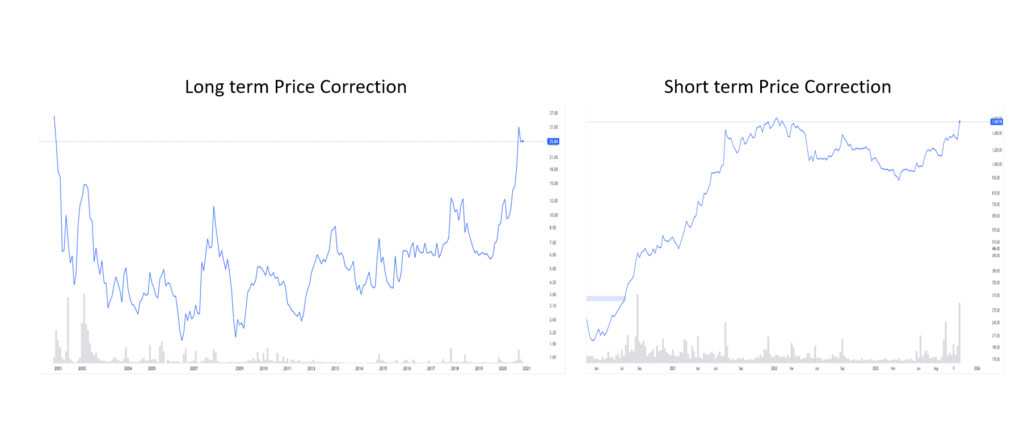
We see that almost every year, we have a correction of 10 to 20%, and in hindsight, we always regret NOT investing in that correction, we plan that next time when the correction comes, we will invest heavily, but again, the same story happens, This is like in the morning I decide I will brush at night, and at night I decide I will do it from next day, and hardly that next day comes 😆!
For Instance: We communicated to our clients to invest in Covid madness around 8200 NIFTY, but few turned up, after the recovery they said next time for sure, again I told them in 2022 at 16000 NIFTY in Russia Wartime, very few did, and again I am telling NOW at 23000 NIFTY!
The question also is why are we saying that?

The above data is clear again that despite this volatility 85% of the time we have seen positive returns in markets,
The Million Dollar Question is What to Buy?

The catch here is, in the last 20 years, the market has corrected 14 times more than 10%, currently is the 15th time, after every correction when recovery comes to the last outperforming sector changes, and that’s where the real catch is in 2008 the best Performing Sector was Real estate, Metal etc, but the recovery was done by Auto & IT, so market may recover but the Sectors may not Outperform, in this our Turtle Advanced Quant can outperform human emotions to find the Outperforming Sector.
So, a Question we need to ask ourselves is:
The current Fall is an opportunity to create Wealth for the Upcoming time or Feeling Sad for the current fall in Portfolio?
Your answer will depend on the Level of your Future Wealth Creation 💵!
Chart Source: beat the Street shared by Nikunj Mehta.
For detailed disclaimer: https://turtlewealth.in/disclaimer/
Regards,
Rohan Mehta


