Endeavour to consistently generate ALPHA by investing in India’s Turnaround Businesses where Leadership & Growth are in common with Turtle’s QUANT-Based Investment Process.
Driven by data, our investment strategy minimizes human bias through a structured, objective process.
Tailored for first-time PMS investors seeking a mature company with moderate volatility and a focus on long-term wealth creation.We continuously select, allocate, and review investments through our trademark PPP (Price, Profit, and People) investment process.
Market Capitalization
Large Cap
0%
Mid Cap
0%
Small Cap
0%
Cash & ETF
0%
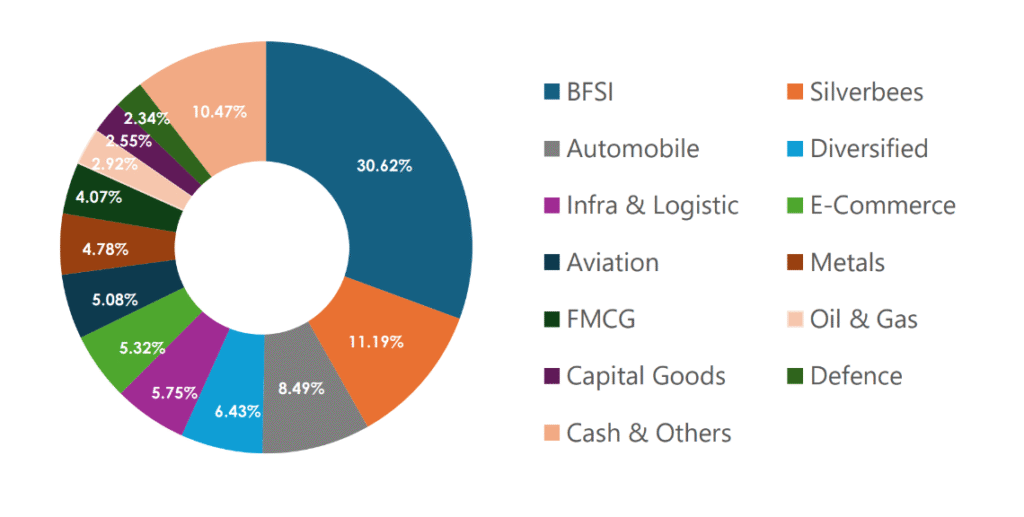
Sector wise allocation
No Data Found
No Data Found
No Data Found
No Data Found
Performance Chart
Wealth Mantra PMS Fund vs S&P BSE 500 TRI
No Data Found
Wealth Mantra PMS Fund vs S&P BSE 500 TRI
Performance Data is as on March 31, 2026. | Figures are inclusive of Fees, Taxes and other charges. | Returns have been calculated using Time Weighted Rate of Return method (TWRR) as prescribed by the SEBI. | Past performance does not guarantee future returns. | Above performance data is not verified by SEBI | SEBI Reg No: INP000006758.
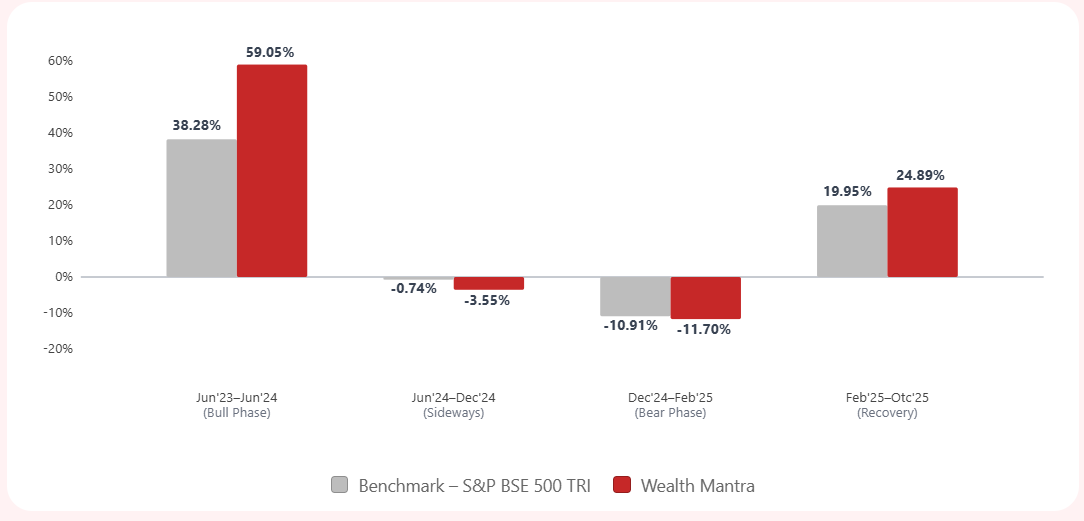
Performance In Bull Phase Vs Sideways Vs Bear Phase Vs Recovery Phase
Wealth Mantra PMS Fund vs S&P BSE 500 TRI
No Data Found
Performance Data is as on October 31, 2025. | Figures are inclusive of Fees, Taxes and other charges. | Returns have been calculated using Time Weighted Rate of Return method (TWRR) as prescribed by the SEBI. | Past performance does not guarantee future returns. | Above performance data is not verified by SEBI | SEBI Reg No: INP000006758.
PMS Fund details
Inception Date
September 2019
Category
Flexi Cap Fund. (Large & Mid Cap)
Benchmark
BSE 500 TRI
Minimum Investment
50 Lakhs
Investing Approach
Quant Based
Fund Manager
Mr. Rohan Mehta
Fund Manager
Rohan Mehta
CEO & Fund Manager
MBA with 20 Years of Experience in Equity Markets.
Proficient in Quant Investing, generated more than 21% CAGR Returns
Find answers to common questions about our investment approach, strategies, and processes. Explore our FAQs to gain clarity and make informed decisions.